What Users Actually Feel
When a product manager compares LLM providers, they look at benchmark scores and pricing tables. When a user interacts with the product, they experience something different: a blank screen, a loading spinner, a stream of words appearing one at a time.
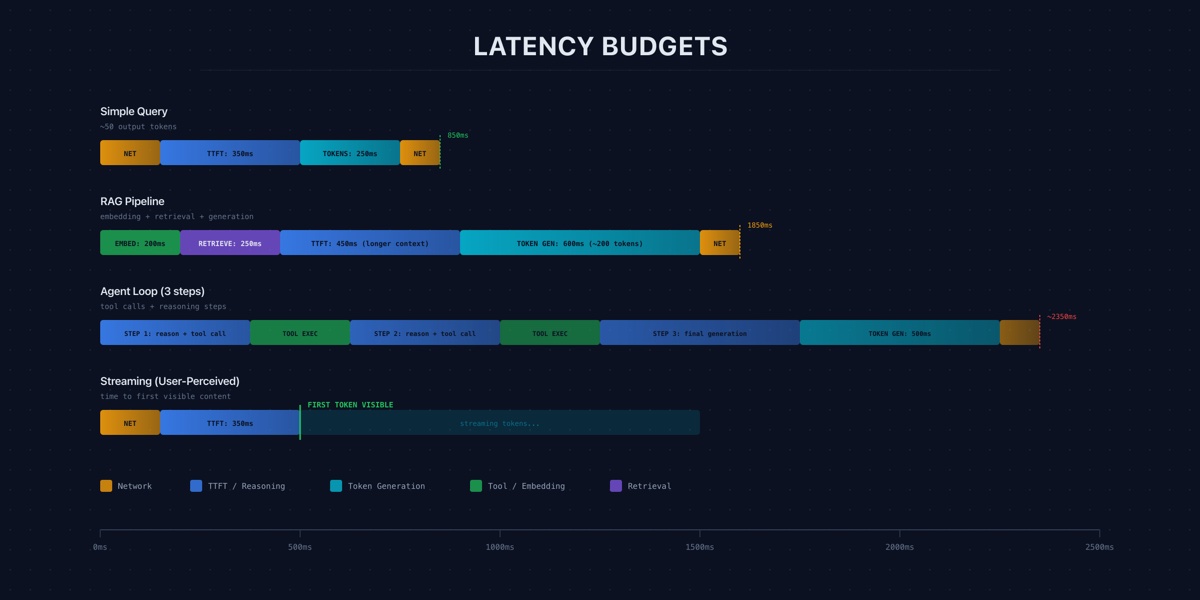
Benchmark throughput tells you how fast the model generates tokens under ideal conditions. It tells you almost nothing about how fast your product feels. Production latency decomposes into three metrics that matter to users.
Time-to-first-token (TTFT) is the delay between the user pressing enter and the first word appearing. This is the “is it working?” signal — the single most important latency metric for interactive applications.
Tokens per second (TPS) during streaming determines the reading experience. Too slow and users wait for each sentence to finish.
End-to-end latency is total wall-clock time from request to complete response. For non-streaming use cases — API backends, batch processing, agent tool calls — this is the only metric that matters.
Most production teams track only end-to-end latency. That is insufficient. A system with a 5-second TTFT and fast streaming feels worse than one with a 0.5-second TTFT and moderate streaming speed, even if total response time is identical.
The TTFT Landscape
TTFT varies dramatically across providers. Current benchmarks show a range from 0.3 seconds for Mistral to 7 seconds for DeepSeek under standardized conditions [S1]. That is a 23x spread. Sub-second TTFT is required for real-time conversational applications to feel responsive [S1].
Provider selection alone — before any optimization — can be the difference between a responsive product and an unusable one. A team that chooses a provider based on benchmark quality and discovers a 5-second TTFT in production has made a product decision, not an infrastructure decision.
TTFT is driven by queue depth, prefill computation, and network latency. Queue depth is the most variable and hardest to control — providers with high demand exhibit TTFT spikes during peak hours that do not appear in controlled benchmarks.
The practical implication: benchmark TTFT at your actual usage patterns. Measure P50, P95, and P99 during business hours. A provider with a P50 of 0.5 seconds and a P99 of 6 seconds has a consistency problem that averages will hide.
Throughput Reality
Token generation speed varies substantially across frontier models. GPT-5 Codex achieves 62-73 tokens per second, while Claude measures at 19-21 — a 3x gap on comparable prompts [S2].
For streaming chat interfaces, this gap is less significant than it appears. The average adult reads at roughly 250 words per minute, or about 5-7 tokens per second. Both 20 and 70 tokens per second are faster than reading speed — the difference is largely invisible to users. The throughput gap matters most for non-streaming use cases: API backends waiting for complete responses and agent loops where each step blocks on the previous one.
Teams optimizing for user-facing streaming often have more headroom than they think. The bottleneck is usually TTFT, not generation speed.
Where Latency Lives
LLM inference has two phases bottlenecked by different hardware resources.
Prefill processes the input prompt in parallel. It is compute-bound and scales with prompt length, which is why long system prompts increase TTFT directly.
Decode generates tokens one at a time. Each token requires reading the full model weights from GPU memory. This phase is the primary end-to-end bottleneck, constrained by memory bandwidth — not compute [S3].
This distinction determines which optimizations help. On an H100 with 3.35 TB/s memory bandwidth, a 70B parameter model in FP16 (140 GB of weights) hits a floor of roughly 42ms per token — about 24 tokens per second — regardless of compute capability. Throwing more FLOPS at a memory-bandwidth-limited decode phase does nothing [S3].
This is why quantization delivers outsized gains. Reducing FP16 to FP8 halves the weight tensor, directly increasing generation speed by reducing bytes moved per token.
UX Thresholds That Should Be SLOs
Latency is not a continuous variable in user experience. Research identifies clear thresholds where perception shifts qualitatively.
At 2 seconds of delay, users rate responses as less thoughtful — attributing latency to output quality rather than infrastructure [S4]. At 4 seconds, perceived quality degrades further. Between 7 and 10 seconds, frustration and abandonment set in [S4].
These thresholds should be encoded as SLOs, not guidelines. A practical latency budget for interactive chat:
- TTFT: Under 1 second at P95.
- Streaming speed: Above 15 tokens per second.
- End-to-end for 500-token response: Under 10 seconds at P95.
The critical insight: latency affects perceived quality, not just perceived speed [S4]. Users who wait longer rate the same response as worse. Latency optimization is a product quality concern, not just an infrastructure concern.
Optimization Techniques With Measured Results
Given the memory bandwidth bottleneck, the most effective optimizations target bytes moved per token.
Speculative decoding uses a small draft model to predict multiple tokens ahead, then verifies them in a single forward pass of the large model. Measured speedups range from 2x to 3.6x [S5]. The technique works best when draft predictions are frequently correct — structured output and code completion see the highest acceptance rates.
FP8 quantization halves the memory bandwidth required per token. Benchmarked results show approximately 1.6x speedup with minimal quality degradation [S5]. This should be the default for any self-hosted setup where latency matters.
Prompt caching stores the KV cache for common prompt prefixes and reuses them across requests. TTFT reductions range from 40% to 60% [S5]. For applications with long, stable system prompts, this is the highest-leverage TTFT optimization available.
Stacking these techniques is where compound gains emerge. FP8 (1.6x) plus speculative decoding (2-3x) plus prompt caching (40-60% TTFT reduction) yields 3-5x end-to-end improvement over a naive deployment [S5]. Each targets a different pipeline stage, so gains are largely multiplicative.
For teams on managed APIs rather than self-hosting, the levers are different: reducing input token count, constraining response length, selecting providers based on latency benchmarks, and routing requests to avoid peak-hour congestion.
What This Means for Your Team
Latency budgets are not a nice-to-have. They are the translation layer between infrastructure decisions and product quality.
Start by instrumenting the three metrics that matter — TTFT, streaming TPS, and end-to-end latency — at P50, P95, and P99. If you are only tracking average end-to-end latency, you are missing the signals that determine user experience.
Set SLOs based on the UX thresholds. Alert on violations. Treat latency regressions with the same severity as quality regressions — because your users already do.